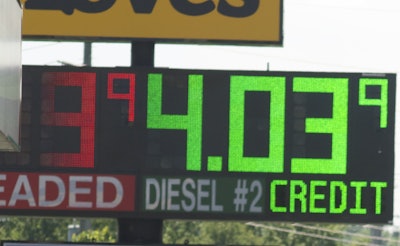
Compared to today, diesel prices during the “good ol’ days” were remarkably stable. Only once during the entire 1990s – at least dating back to March 1994 – did the price of diesel rise or fall by more than 5 cents in a week. During the 2010s, we see a change of that magnitude about once a month on average.
| The number of times the week-to-week change in the national retail diesel price exceeded 5 cents (up or down) 1990s: 1 time in 302 weeks (0.3%)
2000s: 95 times in 521 weeks (18.2%)
2010s: 42 times in 186 weeks (22.5%) |
And consider this: The difference between the lowest and highest prices during the entire 1990s was just 37.6 cents. That is less than the surge in diesel prices during just two weeks in September and October 2005 in the aftermath of Hurricane Katrina and Hurricane Rita.
Given that diesel prices have escalated, it’s understandable that volatility would be greater in terms of cents per gallon. After all, today’s average diesel prices are more than three times the average price in the 1990s: $1.138. So a 1 percent increase or decrease would be about 1.1 cents back then; today, it would be 3.8 cents. But that’s really just a comfort to a mathematician. You live in the world of dollars and cents, so unless your revenue per truck or cash reserves also has more than tripled, diesel price volatility can be a big deal.
Stability quite literally ended with the 1990s. The first double-digit weekly increase was an 11.1-cent jump during the week ended Jan. 24, 2000. Until then, the largest weekly increase had been 5.6 cents four years earlier. The shock – which coincided with a decline in freight demand – shut down thousands of cash-strapped owner-operators and small trucking companies. The crisis led to a resurrection of what once had been a standard arrangement: Fuel surcharges.
It would be late September 2004 before the price of diesel hit $2 a gallon. But thanks to Katrina and Rita, it took only another year for diesel to hit $3. By then, most carriers had fuel surcharge arrangements in place, but the sheer scope of the surge – a net gain of 55.4 cents in five weeks – still was a big problem. Many carriers didn’t have the cash to cover the higher fuel prices until they got the actual surcharge payments from their shippers six or eight weeks later.
The post-hurricane days in 2005 were mild, however, compared to the first half of 2008. In 24 weeks from late January to mid-July, the price of diesel soared $1.505 a gallon to an all-time high of $4.764. During one five-week period in February and March 2008, the average price soared by 69.4 cents, and diesel surpassed $4 a gallon for the first time that April. Again, because prices rose so far so fast, fuel surcharge payments didn’t come fast enough to save hundreds of weak carriers.
But then something unusual happened. For various reasons – mostly related to a faltering global economy – the bottom fell out on diesel prices. From July 21, 2008, to March 16, 2009, prices fell in 33 of 35 weeks, losing $2.70 a gallon. Now we saw something different: Prices were falling so fast that fuel surcharge receipts were outpacing fuel costs. So carriers that probably should have been looking for an exit strategy heading into 2009 hung on because of positive cash flow.
Comparatively speaking, the past four years have been stable, typically marked by shorter-term and less severe streaks of rising and falling prices. We all know, however, that the next hurricane season or conflict in the Middle East can change that in an instant.


![Mack GuardDog Connect Communication[1]](https://img.ccjdigital.com/files/base/randallreilly/all/image/2013/10/ccj.Mack-GuardDog-Connect-Communication1.png?auto=format%2Ccompress&fit=crop&h=167&q=70&w=250)


